

Aumentan los temores a las burbujas, pero los fundamentos del mercado cuentan una historia diferente
Si bien las acciones impulsadas por la IA han impulsado ganancias extraordinarias, las sólidas ganancias corporativas, los datos económicos resistentes y las valoraciones razonables sugieren que el mercado actual difiere de las burbujas pasadas.
Lectura de 5 minutos
PUNTOS CLAVE
- El mercado actual no se parece tanto a las burbujas pasadas como muchos creen.
- Las acciones han superado dramáticamente a los bonos, pero la historia sugiere cautela.
- Las tasas más altas crean desafíos, pero los fundamentos económicos siguen siendo favorables.
El desempeño del mercado de valores, y particularmente los hiperescaladores impulsados por inteligencia artificial (IA) y las acciones de chips, ha provocado un renovado debate sobre si estamos en una burbuja de mercado. En general, si bien hemos visto algunos movimientos parabólicos en algunas acciones que claramente no son sostenibles, hay suficientes diferencias en el mercado hoy en día para disuadirnos de decir que estamos en una burbuja. La comparación más común es con la burbuja tecnológica de finales de los años 1990, y en comparación con ese período, la rentabilidad corporativa es mucho mayor, lo que significa que los múltiplos del mercado son significativamente más bajos. De hecho, los múltiplos del mercado han disminuido en el transcurso de 2026 a medida que los aumentos de ganancias han superado los aumentos de los precios de las acciones. Esperamos que las tasas de rendimiento se desaceleren desde los niveles recientes, pero seguimos siendo optimistas sobre el crecimiento y las ganancias para el próximo año.
Nuestro gráfico de esta semana analiza los rendimientos de una manera un poco diferente al comparar la tasa de rendimiento de las acciones sobre los bonos durante períodos consecutivos de diez años. Hacer esto nos permite ver las tendencias durante un período más largo y lejos del ruido del día a día, o incluso mes a mes, de los mercados. Observar los rendimientos a nivel de clase de activos de esta manera también proporciona una perspectiva de lo que podríamos necesitar considerar en algo más largo que el próximo período de seis a 12 meses. Mientras hacemos esto, podemos ver que las acciones han superado recientemente a los bonos durante el último período móvil de diez años a una tasa que está muy por encima del promedio y cerca de los niveles que a menudo han marcado puntos de inflexión importantes.
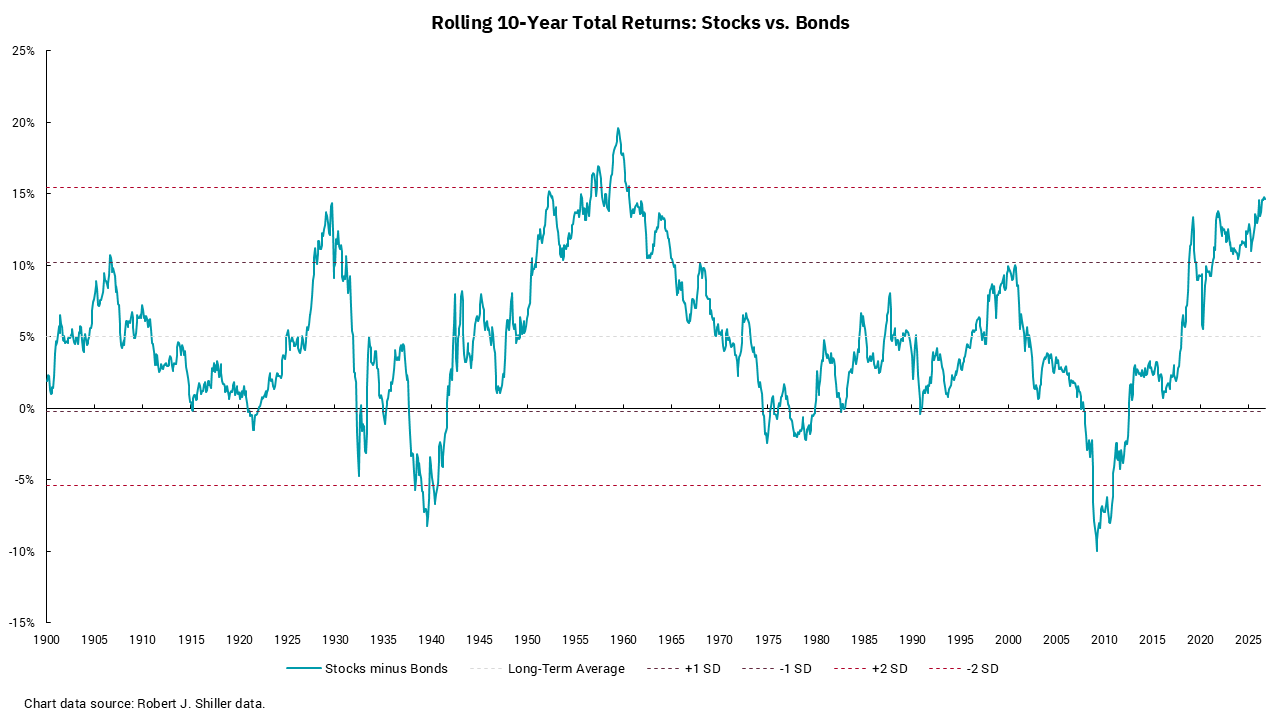
Debido a que el gráfico se remonta a 1900, podemos ver el impacto de los "locos años veinte" y el cambio material en los años posteriores al colapso de 1929. También vemos que el mayor período de rendimiento superior fue durante el período "Nifty Fifty", ya que el mercado se convenció de que había acciones de "cómpralas y olvídalas" que representaban lo que, en ese momento, eran las mejores compañías del mundo. La caída de 1987 está ahí y sí, vemos la burbuja tecnológica de 2000, un período que muchos de nosotros recordamos. En ese momento, dirigía un pequeño producto de renta fija que ofrecíamos a nuestros inversores principalmente orientados a la renta variable. A medida que la burbuja tecnológica envejecía, la Fed estaba subiendo las tasas y la nota del Tesoro a diez años se acercaba a un rendimiento del 7%. Recuerdo claramente una conversación en la que señalaba el atractivo de un rendimiento del 7% para un cliente cuando le preguntaron: "Steve, ¿por qué compraría un Tesoro del 7% a diez años cuando puedo ganar el 7% en un día en el mercado de valores?" A corto plazo, tenían toda la razón. Sin embargo, ¿en los próximos diez años? Bueno, digamos que su percepción cambió un poco.
En la actualidad, la Fed está subiendo las tasas, el Tesoro a diez años está en 5.25%, el más alto desde 2007, y los rendimientos totales para el amplio Bloomberg Aggregate Index son negativos durante los últimos cinco años. Momento en que la tendencia entre los rendimientos de las acciones y los bonos es difícil y parece que el camino de menor resistencia en las tasas es más alto. Sin embargo, nada dura para siempre y eso incluye las acciones de alto rendimiento sobre los bonos durante períodos de tiempo significativos.
Obtenga By the Numbers en su bandeja de entrada.
Suscríbase (Se abre en una pestaña nueva)